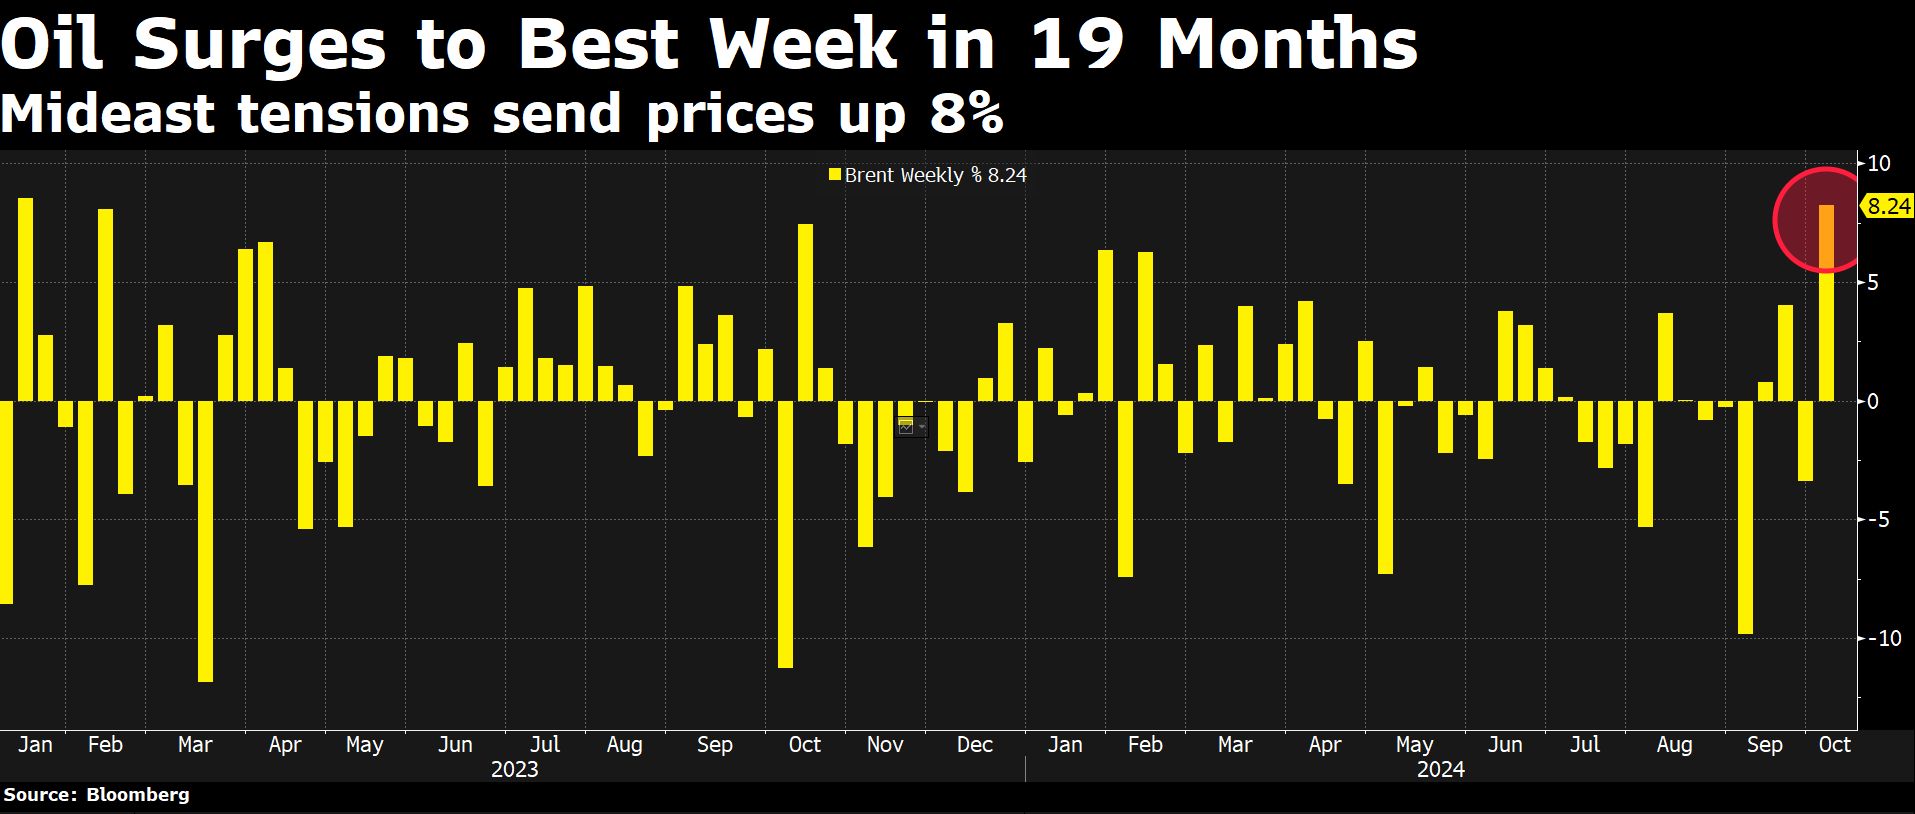
Oil markets saw a dramatic rise yesterday, with Brent jumping 5% to $77.62 a barrel, its highest level in over a month. The marked increase comes amid growing tensions in the Middle East and speculation over potential Israeli strikes against Iranian oil infrastructure. West Texas Intermediate (WTI) followed this uptrend, closing at $73.71, up 5.15% on the day. Today, the rally continues with Brent up 0.83%, reaching $78.16, and WTI up more than 0.8%, settling at $74.27.
The catalyst for this sudden surge was a statement from US President Joe Biden. Asked about the possibility of Israel striking Iranian oil facilities, Biden said: “We are discussing it. » The remark caused a shock to oil markets, fueling fears of potential disruptions to global crude supplies.
The main factors behind the oil price surge include:
- Geopolitical tensions: The conflict between Israel and Iran has intensified, with Iran recently launching a missile attack on Israel, raising fears of retaliatory actions.
- Fears of supply disruptions: Any attack on Iran’s oil infrastructure could have a significant impact on global oil supplies, with Iran being the world’s seventh largest oil producer.
- Concerns around the Strait of Hormuz: Markets are worried about possible blockages in this strategic passage, through which a third of global oil traffic passes.
- Increased risk premium: Increased geopolitical risks are pushing traders to price in a higher risk premium for oil.
Since the start of the week, oil prices have been particularly volatile due to growing tensions in the Middle East. Among the main concerns is the conflict between Israel and Iran, which intensified after the Iranian missile attack on Israel. This has fueled fears of retaliation and impact on oil supply chains, especially since Iran is a key oil producer.
Fears are also fueled by the possibility of blockages in the Strait of Hormuz, a key passage for transporting oil around the world. Faced with these geopolitical risks, traders are increasing the risk premium on oil, which contributes to rising prices.
Market analysts are divided on the long-term effects of these developments. Some warn that oil prices could continue to rise if Israel strikes Iranian refineries and Tehran retaliates by attacking other fields and refineries in the region. Others, however, point to mitigating factors, such as weak demand from China and excess capacity from OPEC+ producers, which exceeds 5 million barrels per day and could offset possible supply disruptions .
The global implications of this price surge are multiple and worrying. Inflation fears are intensifying as a prolonged rise in energy prices could lead to higher prices at the pump as well as gas and electricity bills. Bank of England Governor Andrew Bailey on Thursday highlighted the “very serious” risks of this situation, saying he was monitoring developments very closely.
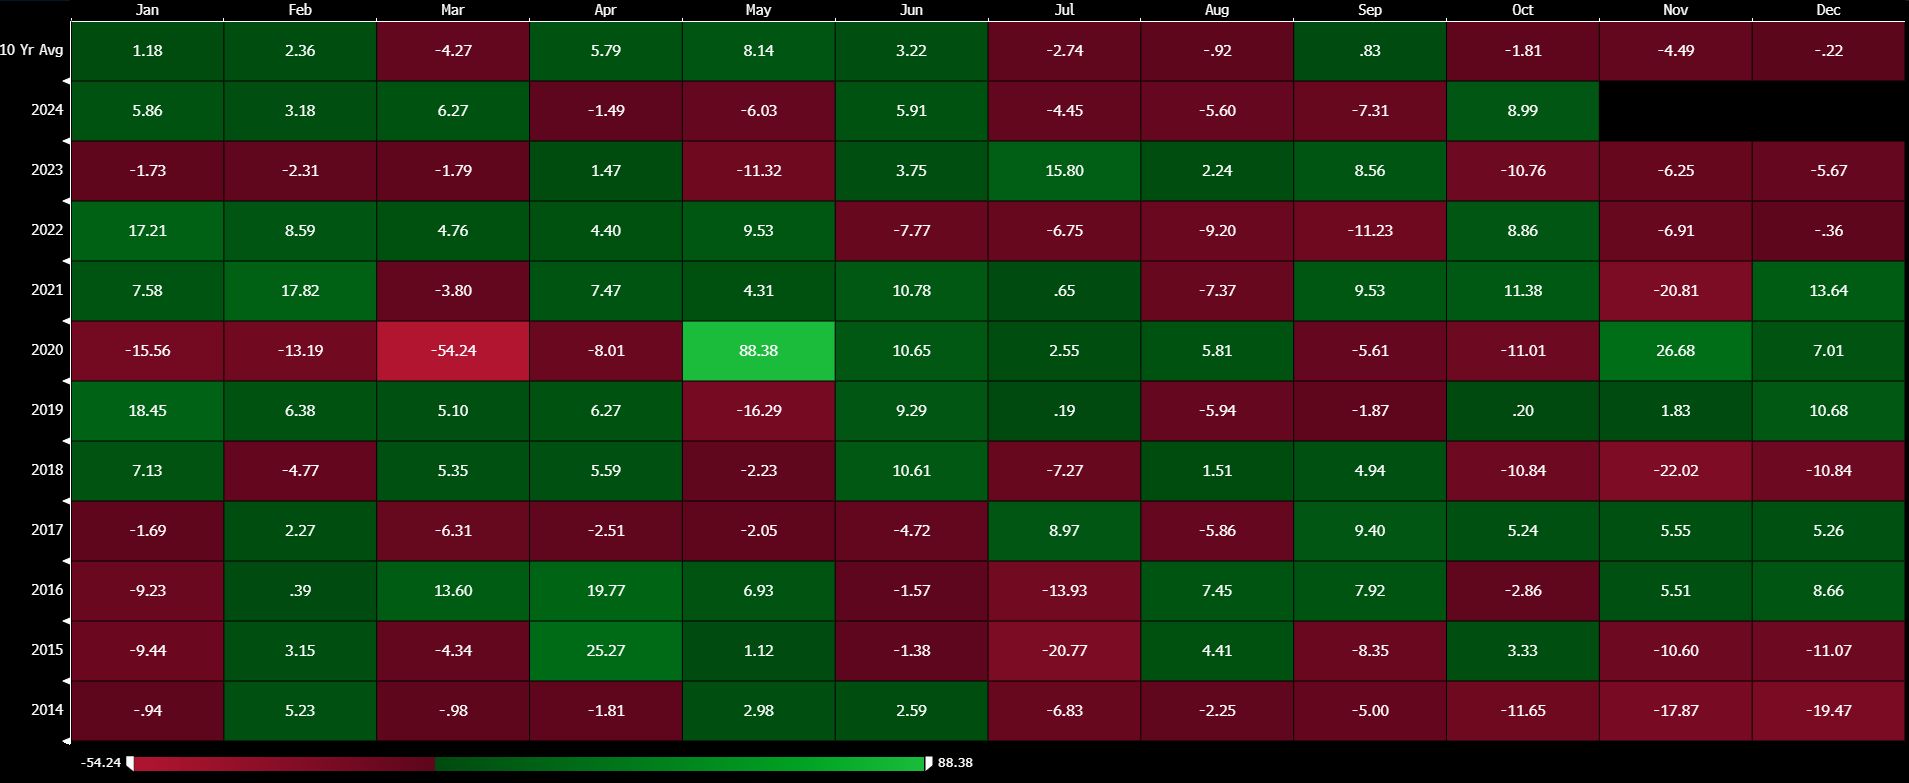
Seasonality graph. Source: Bloomberg LP
Key factors for investors to watch:
- Israel’s announcements or possible actions regarding potential strikes on Iranian oil infrastructure.
- Iran’s response to these threats or actions.
- Movements in the Strait of Hormuz which could disrupt tanker traffic.
- Statements from OPEC+ members on a possible increase in supply to compensate for any disruption.
- Global economic data, particularly from China, likely to impact oil demand forecasts.
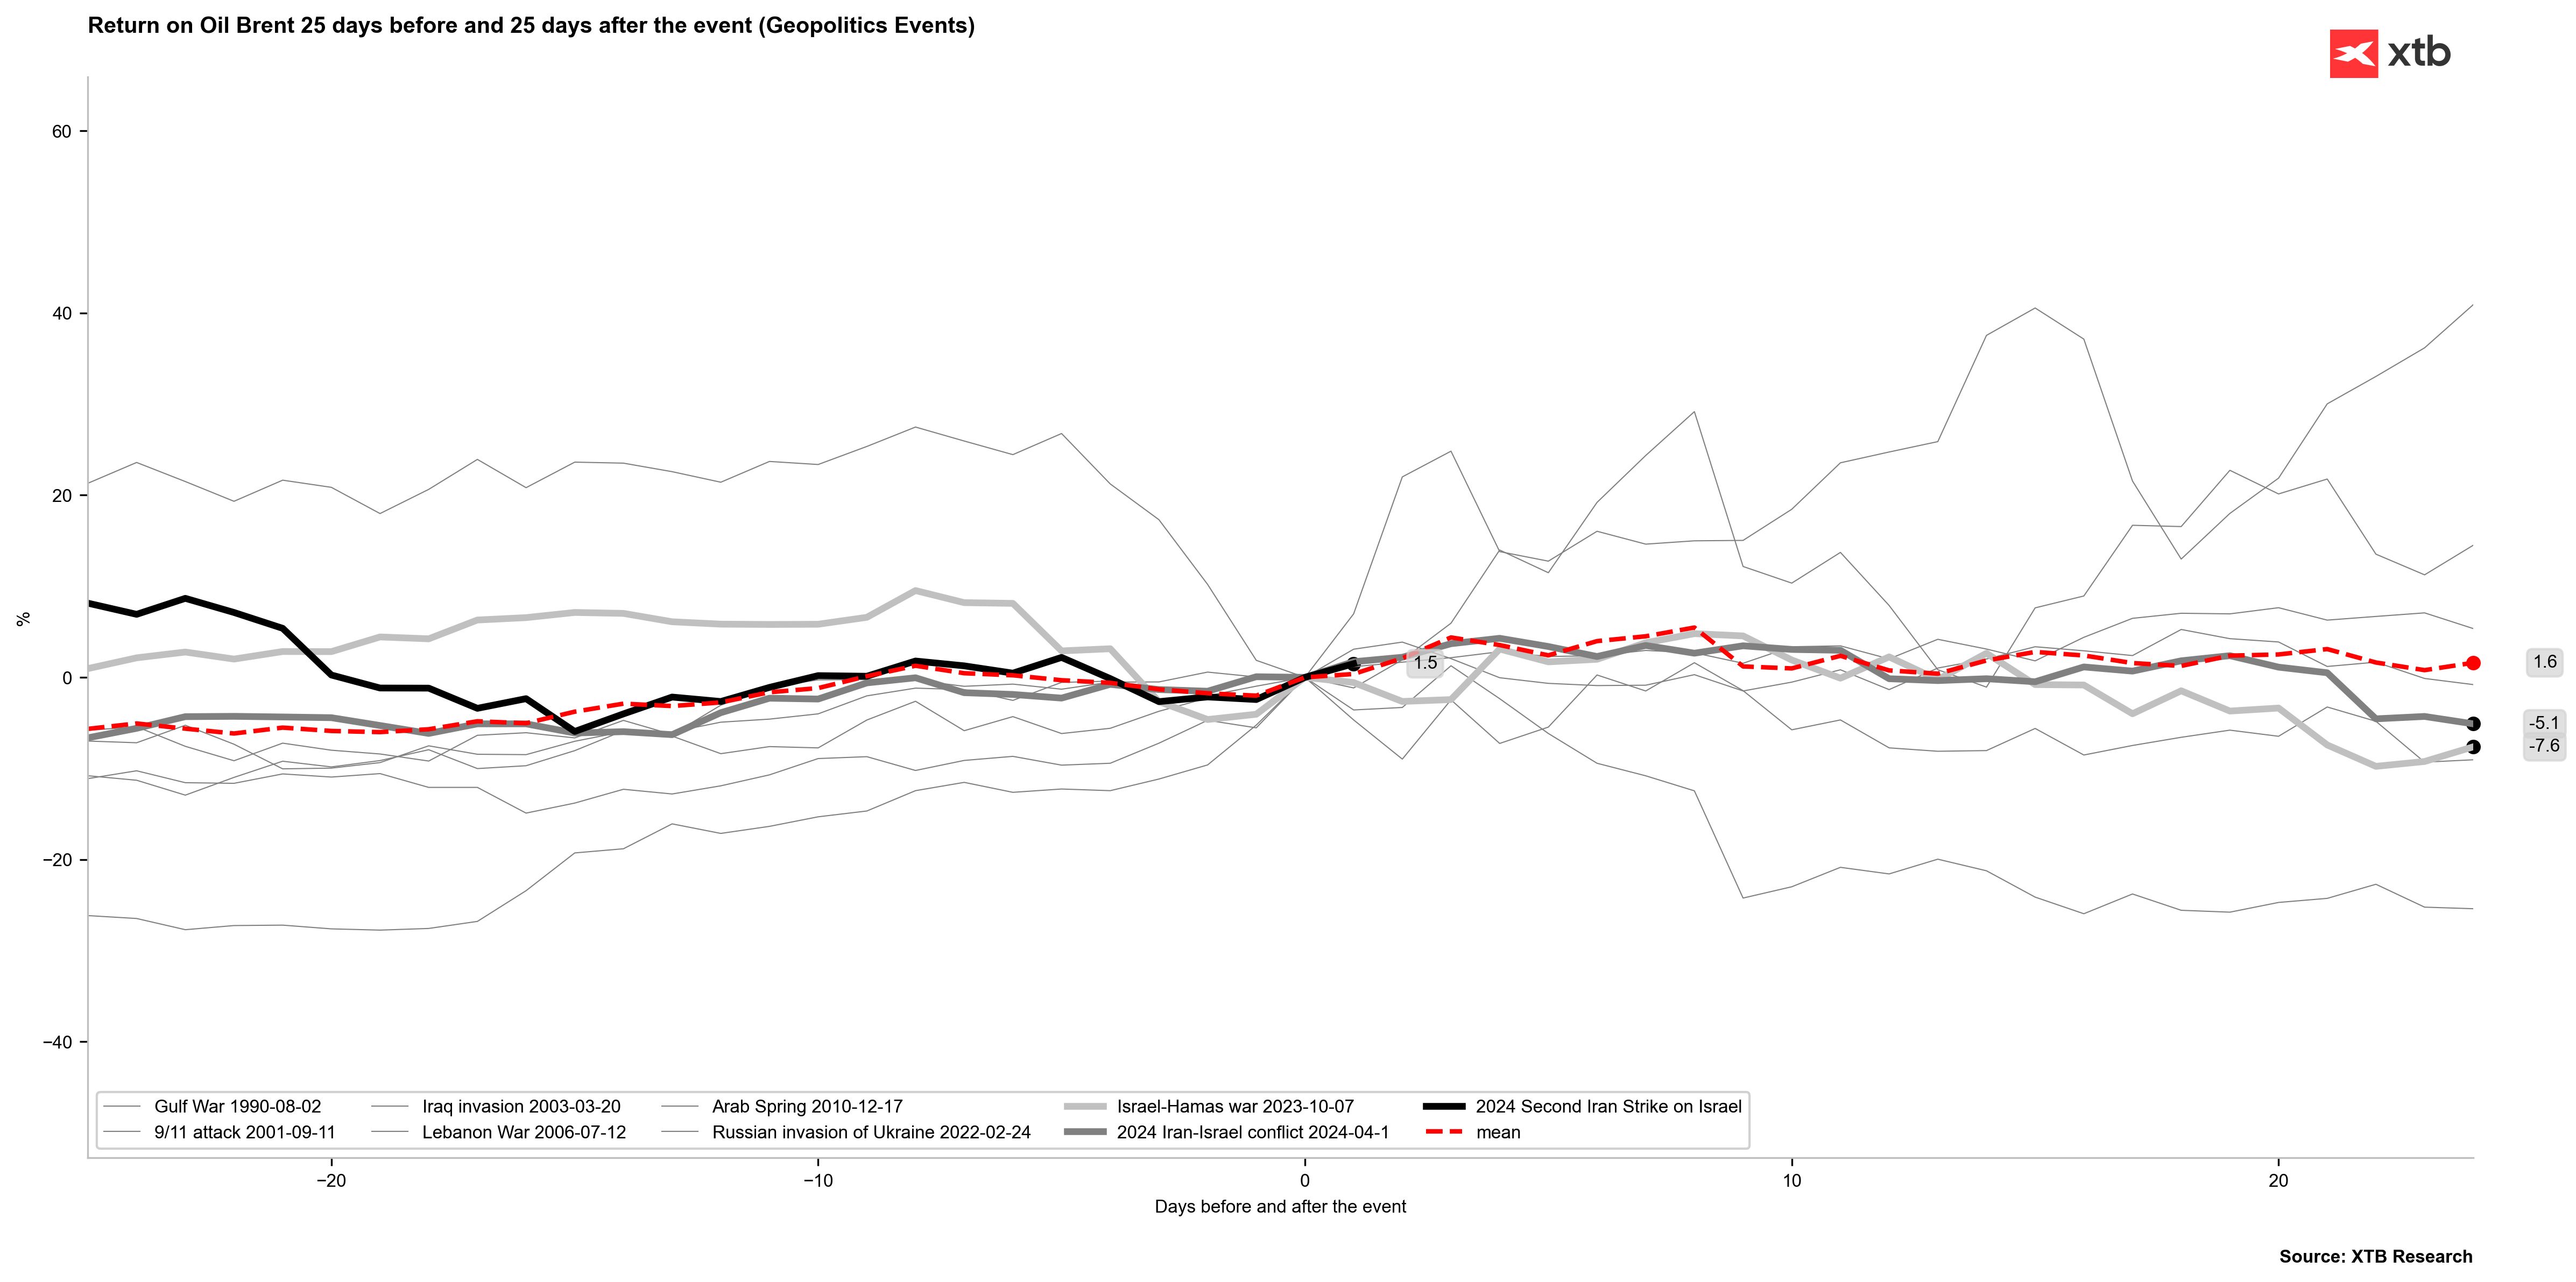
Although the current surge in oil prices is significant, it should be noted that the response is much more muted than that seen during Russia’s invasion of Ukraine in 2022. However, the situation remains very fluid, and any further escalation could lead to even more pronounced price movements in the coming days and weeks. Historically, the largest increases have occurred during the first week following the start of geopolitical tensions.
The sustainability of this price rally will largely depend on how tensions in the Middle East evolve and whether there are any concrete disruptions to oil supplies. Market participants will need to remain vigilant and prepared for increased volatility.
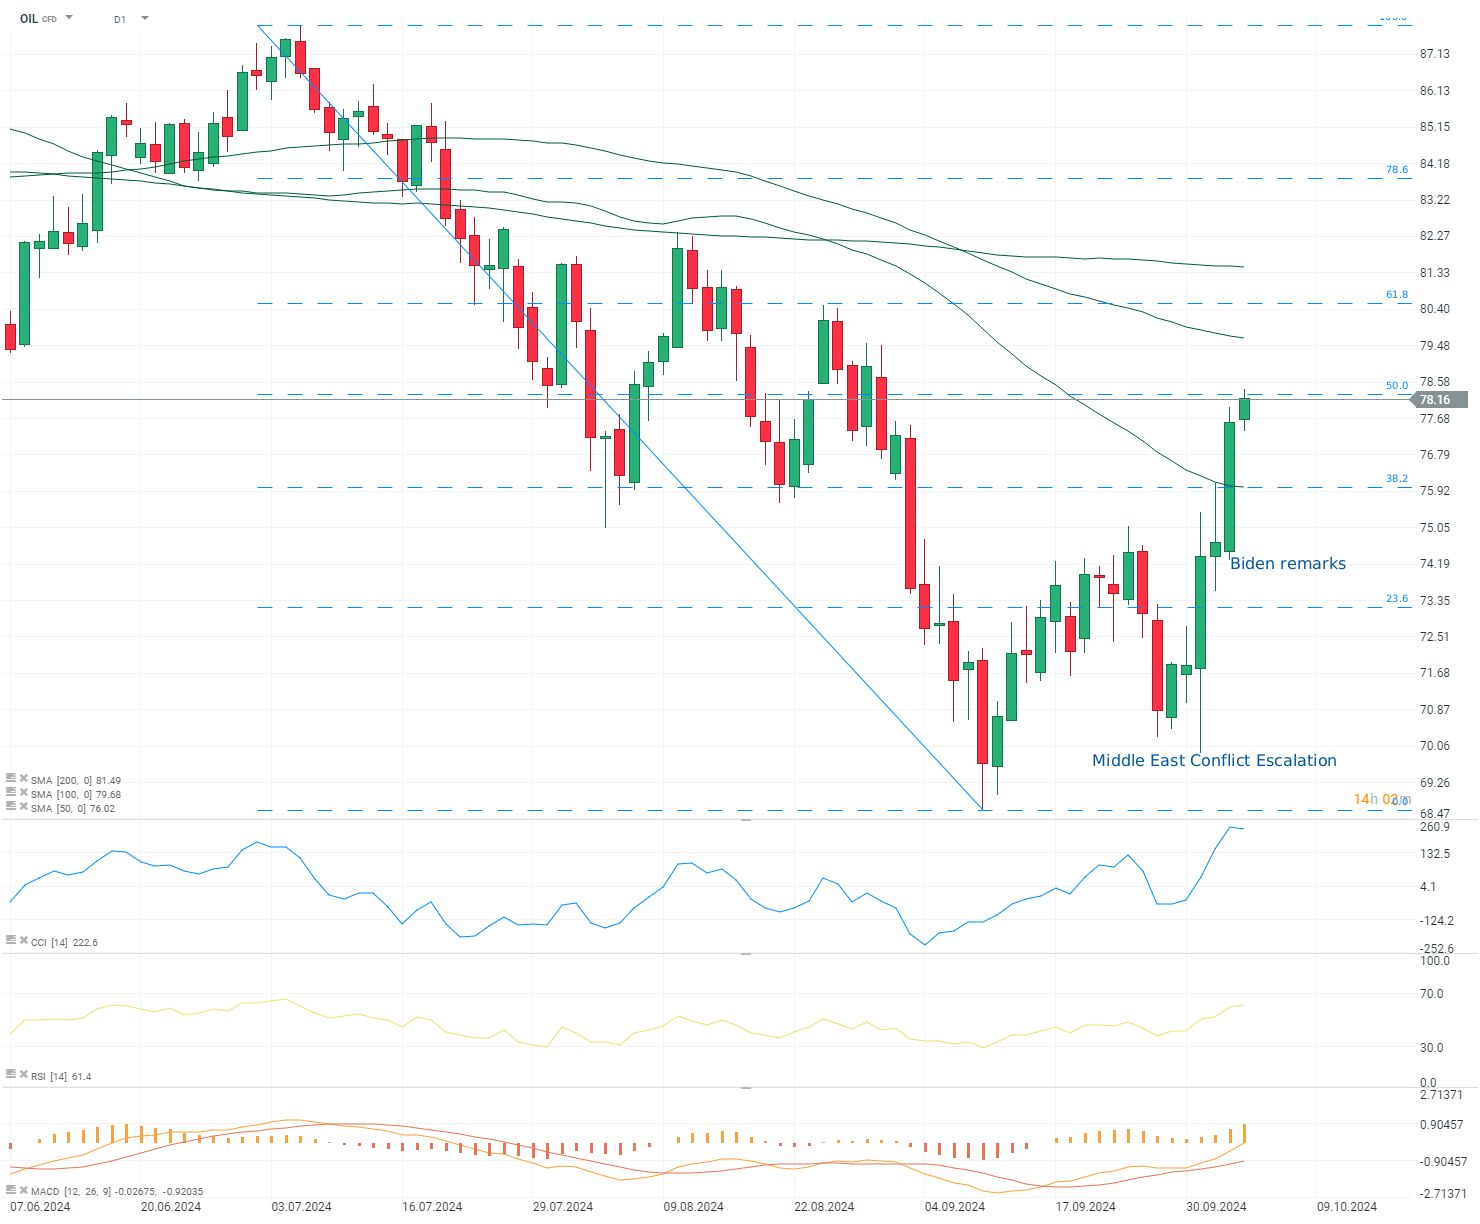
OIL (Intervalle D1)
The Brent contract, represented by the OIL ticker, is approaching the 50% Fibonacci retracement level, which has not played a major role in previous price movements. The key levels to watch are the 100-day simple moving average (SMA), followed by the 61.8% Fibonacci retracement, which has already served as resistance. For the bears to take control, the 38.2% Fibonacci retracement level, aligned with the 50-day SMA at $76, is the critical breakout point. Currently, all oscillators are showing a clear bullish divergence on the daily and weekly charts, although the MACD has not yet issued a buy signal on the weekly chart. Source: xStation
“This content is a marketing communication within the meaning of Article 24(3) of Directive 2014/65/EU of the European Parliament and of the Council of 15 May 2014 on markets in financial instruments and amending Directive 2002/ 92 /EC and Directive 2011/61 /EU (MiFID II) The marketing communication is not an investment recommendation or information recommending or suggesting an investment strategy within the meaning of Regulation (EU) No. 596/. 2014 of the European Parliament and of the Council of 16 April 2014 on market abuse (Market Abuse Regulation) and repealing Directive 2003/6/EC of the European Parliament and of the Council and Directives 2003/124/EC, 2003/125 / EC and 2004/72 / EC of the Commission and Commission Delegated Regulation (EU) 2016/958 of 9 March 2016 supplementing Regulation (EU) No. 596/2014 of the European Parliament and of the Council with regard to standards regulatory techniques relating to technical arrangements for the objective presentation of investment recommendations or other information recommending or suggesting an investment strategy and for the disclosure of special interests or indications of conflicts of interest or any other advice, including in the field of investment advice, within the meaning of article L321-1 of the Monetary and Financial Code. All information, analyzes and training provided are provided for informational purposes only and should not be interpreted as advice, a recommendation, a solicitation for investment or an invitation to buy or sell financial products. XTB cannot be held responsible for the use made of it and the resulting consequences, the final investor remaining the sole decision-maker regarding the position taken on their XTB trading account. Any use of the information mentioned, and in this regard any decision taken in relation to a possible purchase or sale of CFDs, is the exclusive responsibility of the final investor. It is strictly prohibited to reproduce or distribute all or part of this information for commercial or private purposes. Past performance is not necessarily indicative of future results, and anyone acting on such information does so entirely at their own risk. CFDs are complex instruments and carry a high risk of rapid loss of capital due to leverage. 76% of retail investor accounts lose money when trading CFDs with this provider. You need to make sure that you understand how CFDs work and that you can afford to take the likely risk of losing your money. With the Limited Risk Account, the risk of losses is limited to the capital invested.”
- -


)