


Knowing how to spot a market top is one of the most sought-after moves by investors. Although it must be admitted, this quest is somewhat of a utopia.
However, there are effective ways to prepare for a change in market trends. This article looks at on-chain methods and indicators for detect the warning signals of a cycle peak. By understanding these tools, you will be better equipped to anticipate changing trends and make the best possible decisions for your future in the ecosystem.
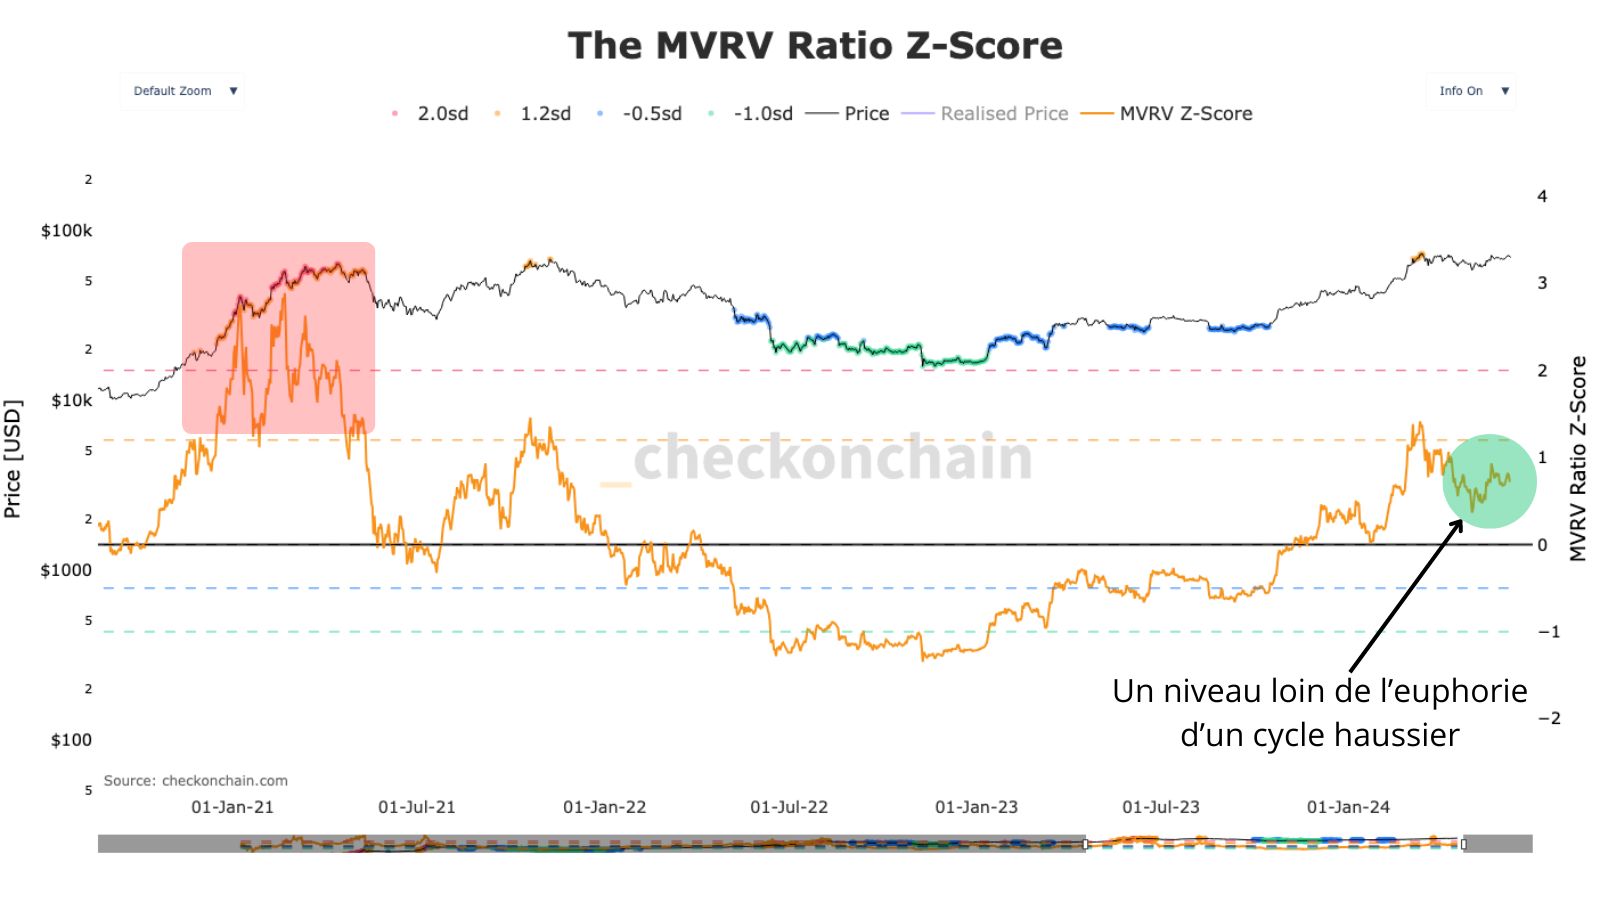
Again this famous MVRV
Why use again and again MVRV (Market Value to Realized Value)? The answer is simple: it allows you to spot times when too many investors have too much unrealized profits.
When this happens, they then begin to sell, creating strong selling pressure in the market.
But why are we seeing a high price and falling unrealized profits (MVRV ratio)?
This is because the average purchase price of BTC increases as its price changes. As time goes on and the cycle progresses, investors buy at higher and higher prices, for fear of missing the boat.
They thus find themselves “trapped” by a purchase price far above its real value. Since they only make minimal gains, they wait before selling.
For example, in 2021, despite continued all-time highs (ATH) from January to May, MVRV has declined, indicating a bearish divergence.

Current situation
Currently, MVRV has not yet reached extreme euphoria levels in this cycle. After the rally of recent months, it corrected and even fell back to levels that can be considered healthy.
This situation could also represent a consolidation or an accumulation phase. Because the market needs time to stabilize, like in 2020 after reaching the old ATH.
To hope to reach new heights, solid foundations are necessary and this is what we are currently experiencing.

NUPL by investor types
NUPL (Net Unrealized Profit/Loss) follows the same logic as MVRV based on unrealized profits or losses.
This indicator signals the level of market overheating among different investor groups.
When the accumulation of groups is in strong profits, it is represented in yellow. In orange, this indicates that long-term investors have significant unrealized profits. In red, this means that short-term holders also have significant profits.
When they are in profit, it means that all investors are. And this indicates total euphoria on the market.

The NUPL also shows the levels where investors are most likely to take profits. A cycle peak is generally reached when the NUPL is at least orange on the graph.
Effectively this means that there are too many investors with too many profits made in too little time. Currently, we have not yet reached this alert level.
Observation of profit taking
What marks a market top is when too many people are selling. And, coupled with little demand to buythis creates an immediate fall in prices.
During the latest rally, fueled by the ETF craze, a large portion of BTC was sold at a profit.
It is important to note that GBTC ETFs accounted for approximately 30% of these sales, which complicates interpretation. Because these sales are not only aimed at making profits, but also at getting out of the high fees associated with these financial assets.

It is also observed that large profit-taking peaks do not always coincide with the final market topbut often occur a few months before.
This observation indicates that selling pressure is less after these peaks, suggesting that the market may continue to rise. We also observed this in 2017 with this stair-step increase.
If the next profit-taking peak is smaller than the previous one, it means the market lacks momentum and demand to continue pushing prices higher, just like in 2021 after an almost instantaneous parabolic rally, followed by a decline crescendo intensity.
These first tools allow us to observe the mechanics of the market and determine when it begins to show worrying signs. The objective is to differentiate an end of cyclemarked by a well-established peak and overheating indicators, normal corrections that occur during bullish cycles.
Currently, we have not yet seen any signals that the March high was the final high of this cycle. On the contrary, the current trend suggests that it is a healthy consolidation of the market, with classic ups and downs during bullish phases. In the next part, we will examine other indicators which will allow us to validate if a peak has actually been reached and if a change in trend is taking place.


