Technical analysis
By TradingRage
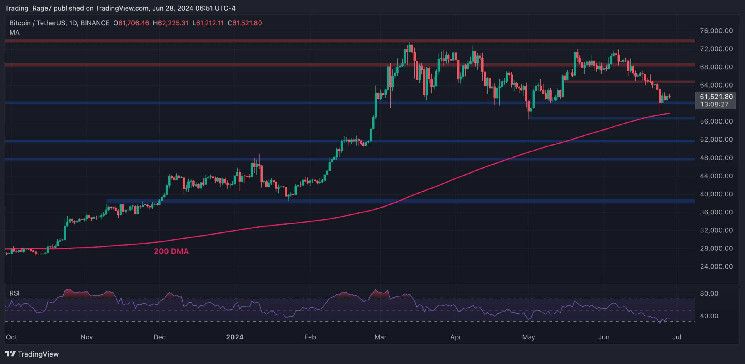
The daily chart
As seen on the daily chart, Bitcoin price has failed to break above the $75,000 resistance zone on several occasions and is currently moving downward. The $65,000 support has also been lost, but the key $60,000 level is currently holding the price.
The 200-day moving average is also around $57,000 and could support the market if it breaks $60,000. Overall, the trend can still be considered bullish as BTC trades above its 200-day moving average.
The 4-hour chart
The 4-hour chart shows that the price briefly fell below the $60,000 support level a few days ago, but quickly climbed back above it. This is classic false breakout behavior and could indicate a rally towards the $65,000 level in the near term.
However, the RSI is still showing values below 50%, which means that the momentum is still in favor of sellers. A drop below the $60,000 level is therefore still possible.
On-Chain Analysis
By TradingRage
Bitcoin Whale Ratio
Analyzing on-chain Bitcoin metrics can be very useful in situations where the market appears to be reversing. This chart shows the BTC whale ratio metric, which measures the ratio of large deposits to exchanges and assumes they belong to whales.
So, higher values could indicate that Bitcoin whales are aggressively depositing their coins on exchanges, which is likely with a view to selling them.
It is evident that the whale ratio has recently reached values above 0.5, which is considerably high. This indicates that whales are selling their coins in considerable volumes. Therefore, if this trend continues, the Bitcoin price could fall even lower as the market would be overwhelmed by oversupply.


