Article premium,
Reserved for subscribers
The organization which measures greenhouse gases emitted in France has published data concerning the emissions of each municipality in France sector by sector. When it comes to transportation, the map of municipalities with the highest emissions closely matches that of the road network.
close
-
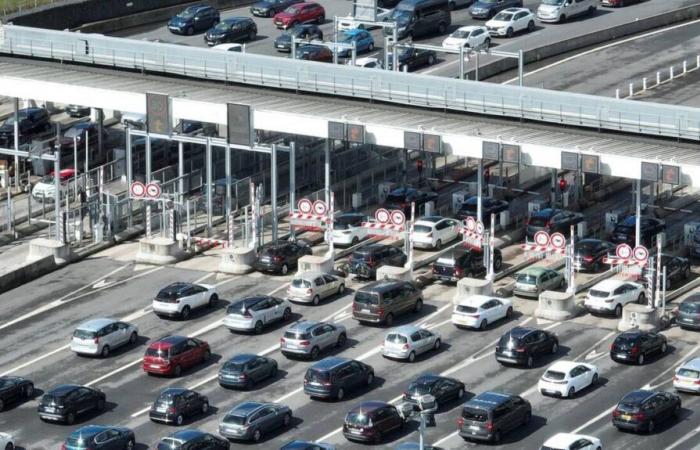
The La Gravelle toll (Mayenne), in July 2023. | THOMAS BREGARDIS / WEST-FRANCE ARCHIVES
In France, the transport sector accounts for no less than 34% of greenhouse gas emissions, the gases responsible for global warming. Although they are the responsibility of almost all French people, these emissions are not distributed uniformly across the country. This can be seen in the map below. Built with data from Citepa, the organization responsible for measuring French greenhouse gas emissions, it represents emissions linked to transport in each French municipality. We see that the municipalities where major roads pass stand out in particular, as well…


