


“Simply Put”, the weekly column from the Multi Asset Group team at Lombard Odier Investment Managers
By Florian Ielpo, Head of Macro, Joshua Voelkel, Investment Analyst and Julien Royer, Quantitative Analyst
In summary:
- Correlations are currently said to be “breaking down,” which could jeopardize portfolio diversification.
- When analyzing the explanatory power of the top few common market factors in a multi-asset universe, it is evident that their influence has indeed diminished recently.
- An analysis in terms of asset “clusters” explains this reduction in explanatory power: China, Japan and the energy sector present unique characteristics in the current investment landscape, explaining this perception of a “ dislocation” of correlations.
At certain points in every investment cycle, we as market observers begin to notice phrases like “the correlations are breaking down.” This observation is crucial because the structure of most of our portfolios is based on the complex concept of diversification. Ideally, correlations should be concentrated enough so as not to be disrupted by ambient market noise, but not too concentrated so as to reap the benefits of diversification across and within asset classes. There has been a lot of talk lately about this phenomenon of correlation breakdown, which prompted us to study the issue for ourselves, from an econometrics perspective. In this week’s “At a Glance” edition, we examine the current state of correlations based on eigenvalue and clustering analysis. These two solid methods allow the data to speak for itself: let’s listen to what it has to say to investors.
Equity values and diversification
To analyze the fluctuation of correlations, a first approach is to examine the eigenvalues of the correlation matrix of asset returns. Although the term “eigenvalue” may seem complex, the concept is closely related to the principle of “principal component analysis” (PCA), a technique used in data analysis. The eigenvalues of a correlation matrix are used to measure information about each common factor that explains the cross-section of returns. For example, if the market factor predominantly explains variations in returns, the eigenvalue associated with this factor will significantly overshadow the others. These “information measures” indicate that the higher the eigenvalue, the more information the corresponding factor contains. There Figure 1 illustrates the explanatory power of the first factors for a wide range of assets, classified by asset class and then aggregated. In the long term, and from the perspective of the current situation, it is evident that the correlations are indeed breaking down. Typically, the first few crossed factors account for 95% of all correlations; However, this figure has recently fallen to 86%, with an uptick during the market’s brief correction. Where is this rupture most apparent? The chart on the right provides the answer: mainly in the area of stocks. Different regions and sectors show that investors’ attention has recently shifted from the market factor to other, as yet unknown, areas. At the same time, the bond world continues to experience duration stress, while credit spreads have remained stable for 18 months.
From 2 to 12 clusters
Another way to understand the fluctuation of correlations is to use clustering methods. Econometrics offers a wide range of these methods, all designed with the common goal of grouping similar objects together based on a defined distance measure. This allows users to analyze how these similarities change over time. The connection with the previously discussed approach using eigenvalues is clear: when the first few market factors explain a significant part of the dynamics of asset returns, large clusters can be formed. Conversely, when early eigenvalues have lower explanatory power for these common market factors, the number of clusters increases because assets begin to look less similar. There Figure 2 presents a heatmap that displays the correlation level between different assets along with the corresponding clusters, such that assets with high correlation are placed close to each other, while assets with low correlation are placed far from each other. Over the long term, similar to Figure 1, the number of clusters is generally limited to two main types: risky assets and hedging assets. However, the more recent data in the bottom chart reveals a dramatic change: the number of clusters has increased significantly. In particular, distinct clusters are now forming around specific assets such as the Hang Seng Index, Japanese bonds or the energy sector, providing insight into the factors that explain past fluctuations observed in values. clean. The current number of clusters found in the correlation matrix analysis has increased from 2 to 12 – a significant increase.
Simply put, correlations are breaking down as idiosyncratic stories have recently gained prominence.
Macro/Nowcasting Corner
This section brings together the most recent developments in our nowcasting indicators for global growth, global inflation surprises and global monetary policy surprises. These indicators make it possible to monitor the most recent macroeconomic developments that move the markets.
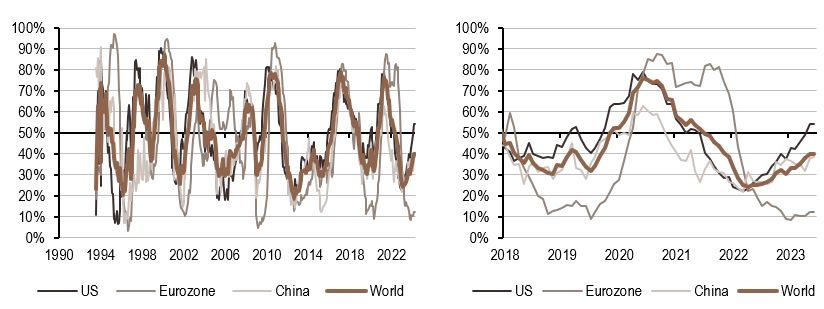
Our nowcasting indicators currently indicate:
- Our growth indicator is on an upward trajectory, but in the United States and China, indicators are slightly declining.
- In the United States and the Eurozone, inflation nowcasting remains high and continues to rise.
- Our monetary policy indicator rose sharply this week, approaching the 50% threshold in the Eurozone and the United States, mainly due to increased consumption in the United States and employment data in the eurozone.
Show article disclaimer
For the exclusive use of professional investors
This document is published by Lombard Odier Asset Management (Europe) Limited, authorized and regulated by the Financial Conduct Authority (the “FCA”), and registered with the FCA under number 515393.
Lombard Odier Investment Managers (“LOIM”) is a trading name.
This material is provided for informational purposes only and does not constitute an offer or recommendation to buy or sell any security or service. It is not intended for distribution, publication or use in any jurisdiction where such distribution, publication or use would be unlawful. This material does not contain personalized recommendations or advice and is not intended to replace professional advice regarding investing in financial products. Before entering into any transaction, the investor should carefully consider the suitability of the transaction for its particular circumstances and, if necessary, obtain independent professional advice on the risks, as well as the legal, regulatory, tax and accountants. This document is the property of LOIM and is addressed to its recipient exclusively for their personal use. It may not be reproduced (in whole or in part), transmitted, modified or used for any other purpose without the prior written permission of LOIM. This document contains the opinions of LOIM, as of the date of issue.
Neither this document nor any copy of it may be sent, introduced or distributed into the United States of America, any of its territories or possessions or areas subject to its jurisdiction, or to or for the benefit of ‘a person of the United States. For this purpose, the term “United States person” means any citizen, national or resident of the United States of America, any partnership organized or existing in any state, territory or possession of the United States of America. America, any corporation organized under the laws of the United States or any state, territory, or possession thereof, or any estate or trust subject to United States federal income tax United, whatever the Source of its income.
Source of figures: Unless otherwise stated, figures are prepared by LOIM.
Although certain information has been obtained from public sources believed to be reliable, without independent verification we cannot guarantee its accuracy or the completeness of any information available from public sources.
The views and opinions expressed are for informational purposes only and do not constitute a recommendation by LOIM to buy, sell or hold any security. Views and opinions are current as of the date of this presentation and may be subject to change. It should not be construed as investment advice.
No part of this material may be (i) copied, photocopied or duplicated in any form, by any means, or (ii) distributed to any person who is not an employee, officer, director or an authorized agent of the recipient, without the prior consent of Lombard Odier Asset Management (Europe) Limited. In the United Kingdom, this material is marketing material and has been approved by Lombard Odier Asset Management (Europe) Limited which is authorized and regulated by the FCA. ©2022 Lombard Odier IM. All rights reserved.


